Toy Data (PEGASUS Framework applied) 🎠
Toy data
This toy data is an illustration of the type of data commonly found in PEG publications. It shows two loci identified by lead associations from a GWAS for the trait myocardial infarction. Each locus contains multiple nearby candidate effector genes (Gene 1–6).
The bottom table summarises the supporting evidence for each gene — including eQTLs, predicted functional impact, gene expression in aorta, gene prioritisation scores generated by PoPS, and the authors’ overall conclusion.
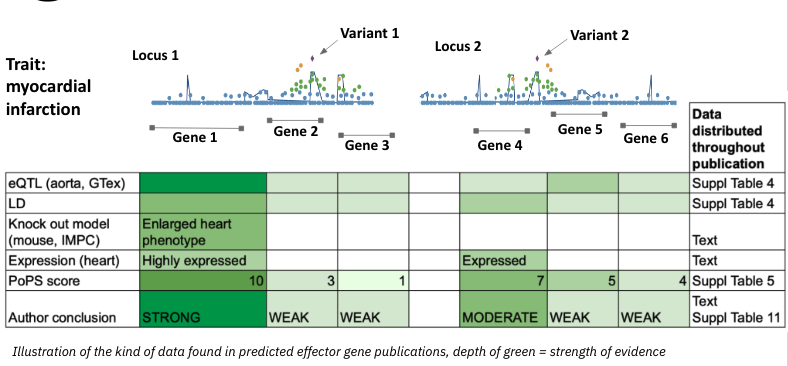
Importantly, in publications this type of evidence is often scattered across the main text and multiple supplementary tables, making it difficult to compare, integrate, or reproduce.
PEG Evidence Matrix
PEG Evidence Matrix propose presenting all evidence in a single structured table. The following table illustrates how the same information can be reformatted into a unified matrix.
| PrimaryVariantID | rsID | GeneID | GeneSymbol | LocusRange | LocusID | GWAS_pvalue | FUNC_CADD | QTL_eQTL_aorta_pvalue | EXP_aorta_RPKM | PERTURB_mouse | INT_pops | INT_CombinedPrediction_AuthorScore |
|---|---|---|---|---|---|---|---|---|---|---|---|---|
| chr1:100000:T:C | rs1234 | ENSG00000000001 | Gene 1 | chr1:99500-115000 | rs1234 | 4.00E-09 | 18.2 | 7.00E-07 | 8.7 | enlarged heart | increased heart weight | 10 | STRONG |
| chr1:100000:T:C | rs1234 | ENSG00000000002 | Gene 2 | chr1:99500-115000 | rs1234 | 4.00E-09 | 3.45 | 0.01 | NA | NA | 3 | WEAK |
| chr1:100000:T:C | rs1234 | ENSG00000000003 | Gene 3 | chr1:99500-115000 | rs1234 | 4.00E-09 | 6.4 | 0.05 | NA | NA | 1 | WEAK |
| chr2:20000:A:G | rs5432 | ENSG00000000004 | Gene 4 | chr2:19000-21000 | rs5432 | 3.00E-08 | 15.62 | 8.00E-05 | 1.3 | NA | 7 | MODERATE |
| chr2:20000:A:G | rs5432 | ENSG00000000005 | Gene 5 | chr2:19000-21000 | rs5432 | 3.00E-08 | 2.13 | 0.2 | NA | NA | 5 | WEAK |
| chr2:20000:A:G | rs5432 | ENSG00000000006 | Gene 6 | chr2:19000-21000 | rs5432 | 3.00E-08 | 4.4 | 0.05 | NA | NA | 4 | WEAK |
PEG List
The PEG List distils the matrix into a concise summary, highlighting the strongest candidate gene at each locus. The PEG List Foundational model records whether evidence was considered (tick = data present, blank = not assessed) and reflects the author’s integrated conclusions for top genes.
| PrimaryVariantID | GeneSymbol | Variant-centric | Gene-centric | INT_AuthorScore | |||
|---|---|---|---|---|---|---|---|
| GWAS | FUNC | QTL | EXP | PERTUB | |||
| chr1:100000:T:C | Gene 1 | STRONG | |||||
| chr2:20000:A:G | Gene 4 | MODERATE | |||||
Tick = data/value present. Blank = not assessed. Ticks do NOT imply supportive vs negative.
Author conclusions and provenance are summarised here; detailed information for each evidence category is available in the evidence matrix.
PEG Metadata
PEG Metadata — Provides the detailed context behind the PEGASUS Matrix, recording column definitions, provenance, biosamples, and methods so that PEG evidence is fully interpretable and reproducible. Here, the data is presented in
- (i) tabular format suitable for submission to a resource or presentation as a supplementary table in a publication and
- (ii) machine readable format suitable for download from a data resource and re-use in an automated pipeline.
PEG Metadata in tabular format (suitable for submission)
- 📂 Dataset description
- 🧬 Genomic Identifier tab
- 🔎 Evidence tab
- 🔗 Integration tab
| trait_description | trait_ontology_id | peg_source | gwas_source | gwas_sample_description | sample_size | case_control_study | sample_ancestry | sample_ancestry_label |
|---|---|---|---|---|---|---|---|---|
| Ascorbic acid 3-sulfate levels | EFO_0800173 | PMID:36357675 | PMID:36357675 | 6,136 Finnish ancestry individuals | 6136 | False | Finland | European |
| variant_type | variant_information | genome_build | gene_id_source_version | gene_symbol_source_version | gene_info | locus_type | locus_id | locus_info |
|---|---|---|---|---|---|---|---|---|
| lead | The primary variant is the variant with the most significant association p-value in the study | GRCh38 | Ensembl v109 | HGNC 2025-07-30 | NA | LD | Lead SNP | NA |
| column_header | column_description | evidence_stream_tag | evidence_category | evidence_category_abbreviation | variant_or_gene_centric | source_tag | method_tag | threshold | note |
|---|---|---|---|---|---|---|---|---|---|
| GWAS_pvalue | Association p-value for each variant from the GWAS study | GWAS | Genome-wide association (GWAS) signal | GWAS | variant-centric | NA | NA | NA | NA |
| FUNC_CADD | CADD score representing the predicted functional impact of the variant | FUNC | Predicted functional impact | FUNC | variant-centric | source_cadd | NA | NA | NA |
| QTL_eQTL_aorta_pvalue | p-value from expression QTL (eQTL) analysis in aorta tissue | eQTL | Molecular QTL | QTL | variant-centric | source_gtex_aorta_qtl | soft_fastqtl | qvalue < 0.05 | NA |
| EXP_aorta_RPKM | Gene expression level in aorta tissue, measured in RPKM | EXP | Expression | EXP | gene-centric | source_gtex_aorta_rna | NA | NA | NA |
| PERTURB_mouse | Phenotypic effects of the gene from IMPC knockout mouse models | PERTURB | Perturbation | PERTURB | gene-centric | source_impc | NA | NA | NA |
| integration_tag | column_header | column_description | author_conclusion | evidence_streams_included | integrations_included | method_tag | threshold | note |
|---|---|---|---|---|---|---|---|---|
| pops | INT_pops | Integrated score based on multiple evidence types for the prioritised gene | False | FUNC | eQTL | pQTL | FM | 3D | PHEWAS | TWAS | NA | soft_pops | score > 3 | NA |
| AuthorScore | INT_AuthorScore | Combined prediction based on manual review of all evidence types and PoPS output | True | PROX | REG | LIT | PoPS | pops | method_customised | NA | NA |
- 📚 Source tab
- ⚙️ Method tab
| source_tag | provenance | file_name | version | url | accession_id | doi | sample_origin | tissue | cell_type | cell_line | disease | life_stage | treatment | sex | species | description | |
|---|---|---|---|---|---|---|---|---|---|---|---|---|---|---|---|---|---|
| source_cadd | CADD | All possible SNVs of GRCh38/hg38 incl. all annotations | v1.7 | link | NA | NA | NA | NA | NA | NA | NA | NA | NA | NA | NA | NA | NA |
| source_gtex_eqtl | GTEx | GTEx_Analysis_v10_eQTL.tar | v10 | link | NA | NA | aorta | primary tissue | NA | NA | healthy | adult | None | mixed | mixed | Homo sapiens | Bulk aorta tissueSamples from healthy adult human donors in GTEx v10. Used for eQTL discovery. Donors aged ~20–70 years, male and female. |
| source_gtex_aorta_RNA | GTEx | GTEx_Analysis_v10_RNASeQCv2.4.2_gene_tpm.gct.gz | v10 | link | NA | NA | aorta | primary tissue | NA | NA | healthy | adult | None | mixed | mixed | Homo sapiens | Bulk aorta tissuesamples (GTEx v10) from healthy postmortem adult human donors in GTEx v10. Used for RNA expression profiling. Donors aged ~20–70 years, male and female. |
| source_impc | IMPC | IMPC_genotype_phenotype.csv.gz | 23 | link | NA | NA | multiple | IMPC mouse knockout models | NA | NA | NA | mixed | gene knockout | mixed | mixed | Mus musculus | Mice with single-gene knockouts generated by the IMPC project. |
| method_tag | method_mode | software_name | software_version | software_url | software_doi | method_description | note |
|---|---|---|---|---|---|---|---|
| soft_fastqtl | computational | FastQTL | v1.0 | link | 10.1093/BIOINFORMATICS/BTV722 | NA | NA |
| soft_pops | computational | PoPS | v1.0 | link | 10.1038/s41588-023-01443-6 | NA | NA |
| method_customised | manual | NA | NA | NA | NA | An integrated predictionderived from expert review of all evidence types together with PoPS output. The strength of support for a gene is classified as weak, medium, or strong based on professional judgement: | NA |
PEG Metadata in YAML (suitable for reader)
Using YAML for metadata keeps all information on one page in a structured format, so users can easily search and extract the details they need, and is both human and machine-readable.
Show YAML file
Download Data
If you would like to download the data to investigate further, we provide the following resources:
- Schema: PEGASUS-v0.0.2.xlsx
- Submission template: Metadata_Template-v0.0.2
- Example data:
- Toy data: Download ZIP · Browse on GitHub
- Real data: Download ZIP · Browse on GitHub